

Market Intelligence

The S&P made a new high Tuesday and an intraday slight new high on Thursday. Friday was a rough day. The loss was 0.7% for the week.

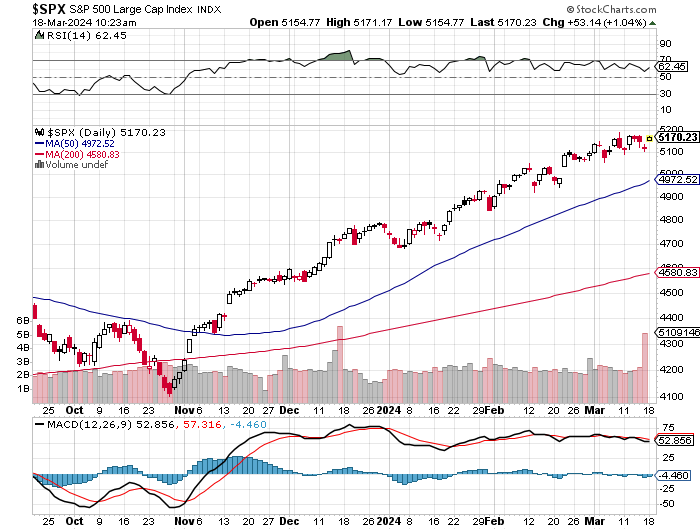
The S&P made another new high!! The market has been churning with an upward bias since the early in the year's small pullback.Notice above, the green has been declining meaning the large block buyers have been selling since early March.The public has been a buyer in recent weeks. The volume Friday was double normal.
The week ended with a poor NASDAQ performance due to options selling on options expiration day and disappointing results by ADBE, strong company.
I wrote a Friday report saying the short term supply/demand factors look less favorable in the next 30 days. This is the first time since the first week year the momentum trade has some impediments ahead. I will go over them.
Goldman mentions that its desk already has orders for sale. With equities outperforming bonds, it could encourage rebalancing.
Quarter-end selling
Only 10 trading days left to quarter-end. "Pension fund equity supply around quarter-ends are usually the biggest, as pensions de-glide and immunize. We are seeing this every day now. We have -$25B for sale on Q -end" (GS program trading desk).
GS Corporate blackout window starts today...
...demand drops by -35% from the largest buyer of equities.
The National Association of Activity Managers index asks the net equity exposure of a fund. It made a high for the year with a several week spike to 104.75%. Hedge Funds allow for this to go above 100% due to leverage.
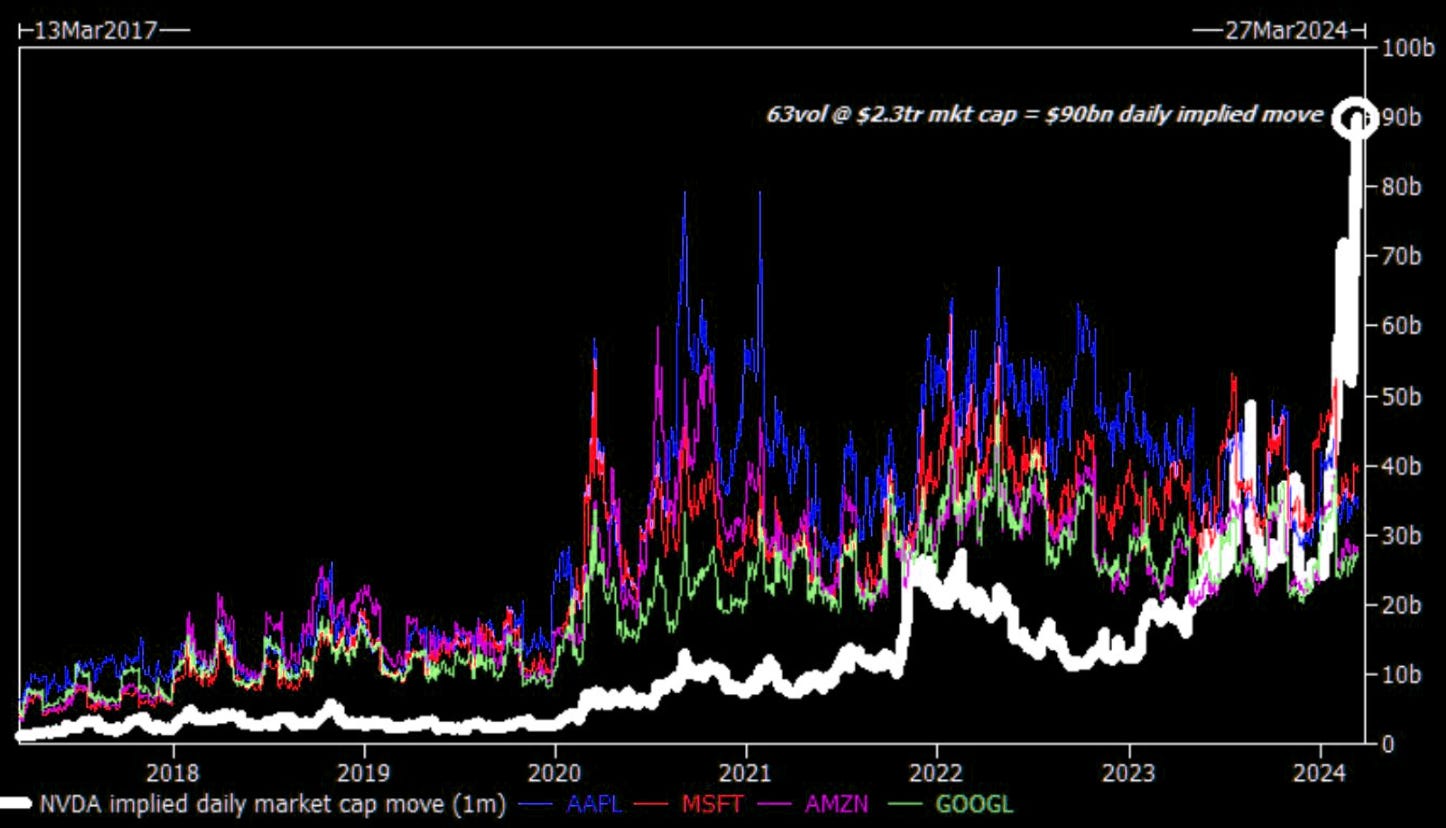
The new leverage is options as opposed to margins,much more than 50%. The king of options is NVDA . The chart below shows the explosion of options trading in NVDA. These are not long term holders, but create short term buying as market makers buy the stock as a hedge of the options contract. The other lines are high quality growth stocks, favorites of option speculators.
The VIX chart is creating a favorable pattern. With so many uncovered options sold, extreme complacency, the VIX could have a run up. On Thursday, Goldman recommended buying the VIX

The CTA and other algorithm funds could be large sellers. See below. The CTA guidelines
Over the next 1 week…
Flat tape: Sellers $566mm ($2.2B out the US)
Up tape: Sellers $43mm ($2.9B out the US)
Down tape: Sellers $11.4B ($5B out the US)
Over the next 1 month…
Flat tape: Sellers $3.3B ($3.8B out the US)
Up tape: Buyers $12.8B ($1.9B out the US)
Down tape: Sellers $168.4B ($48.2B out the US)
The net is if the S&P goes below 4,996 the CTA's will start a $48 billion sell program. If the NASDAQ goes below 17,725, the CTA's will start a large sell program.
The Bulls Bear ratio jumped in the last several weeks to an extreme level.
The selling to pay taxes is larger this year.
"$265 Billion In Capital Gains Tax Selling: Morgan Stanley Warns Momentum Mauling Is Coming, Thanks To The IRS"
The NVDA presentation on Monday has been mentioned for weeks as a major stimulus. It will be over on Tuesday with a lot of traders loaded up with the stock. It is worth watching a genius at work.
Fundamentally, oil could be a risk if it follows through on its breakout above 80. It would have inflationary implications.
The interest rates seem have taken on a new life on a supply demand basis.
While long rates remaining high may not be negative to AI concept growth stocks, it impacts other groups.
The big event of the week is the Fed meeting on Wednesday. The Fed members will have new forecasts and they will talk about the quantitative tightening.I expect a continuation of selling, but possibly selling more mortgage paper and less Treasuries.
There could be surprises either for better or worse. It is a tough read with so many conflicting forces.
I am am not certain there will be pullback. However, the line up of factors in the near term have more inhibiting ones together than we have seen at any other time this year.
Blub, blub
Jerry