
Market Intelligence
Market Intelligence
A new regime for a while ?? Tough set up for growth near term.

The S&P 500 fell 3.05% last week. It was down every day !!!


The main event last week was the sudden change from growth. An important background to this is that those stocks had done so well that they were heavily owned. Also, they were bought by traders and algorithm funds because these investors are very influenced by trend, buying stocks in up trends. This cohort had dramatically outperformed other groups of stocks.
Importantly, this segment has been fundamentally strong currently. These are typically held by long term investors that are not influenced by Technical market factors.
These stocks were generally in a holding pattern after a many month rally. The group had become momentum leaders in a an extraordinary five month rally.
A very important factor was a change in the perception that earnings were going to accelerate rapidly. ASML reported April 17th. It downgraded its near term growth expectations as orders decelerated. Last time it reported it gave glowing expectations that caused a rally in the whole Semi group. The Semi ETF broke downward on that day.
Last week Taiwan Semi reported and cut its expectations as orders overall slowed beyond AI.
These are two special companies in the semi cycle. Their comments had analysts declaring the cycle has turned. ASML had a sudden turn down in orders from China. Evidently the Chinese were ordering extra in case they get shut out due to geo political policies.
The Semi ETF took another leg down. See below.
There have been a number of companies beating as usual, but trimming expectations. This impacts the need to chase the stock.

In a very short period we got some fundamental near term worries. This tapers expectations at a time these stocks have steep gains with little consolidation, strait up momentum.
Another significant element was the algorithm systematic investment funds getting sell signals last week. These fully invested trend followers begin sell programs. As their index holdings are sold, the unwind causes selling of the heavily weighted stocks in the index. Of course, growth is the most heavily weighted in the indexes.
The CTA group is an example. A Goldman estimates is that this group could sell $59 billion in the coming 4 weeks. See the algorithm plan below.
Over the next 1 week…
Flat tape: -$4.5bn to sell (-$5.8bn SPX to sell)
Up tape: +$3bn to buy (-$2bn SPX to sell)
Down tape: -$29bn to sell (-$10bn SPX to sell)
And over the next 1 month…
Flat tape: -$19bn to sell (-$11bn SPX to sell)
Up tape: +$17bn to buy (-$157m SPX to sell)
Down tape: -$229bn to sell (-$59bn SPX to sell)
There are other systematic investment plans, like the Risk Parity group. ..
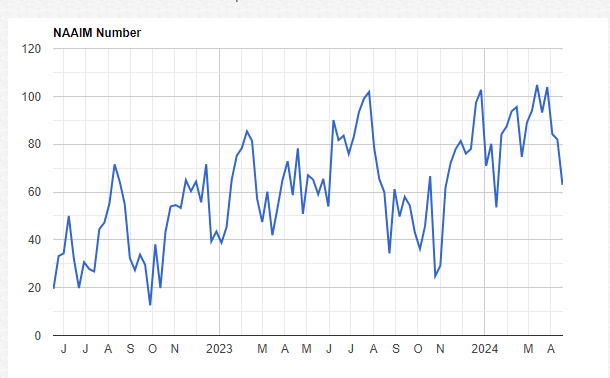
The National Association Of Active Managers is mostly growth oriented and includes hedge funds. It asks members what is their current invested position.
This survey was at 104% less than a month ago.In several weeks it has dived to 62%. In the mild January dip it was at 52. In late October is was at 20.from 101 in July.
The broader picture has been one of excesses for months. The Call to Put Ratio is has been on a spike for months. Notice this has not typically been at such high levels for an extended time. This has tended to be a very temporary phenomenon.

It is a byproduct of the momentum surge of bullishness.
The Bulls reached 62.5 a few weeks ago. Above 60 is an extreme. Over the decades, the extreme Call to Put Ratio has had an opposite unwind. The length of the exuberance has been for longer than normal.
The market may be entering a new phase. There are a lot of "cheap" stocks that require an improving economic environment and lower interest rates and other groups that are investable. The growth area had become the all weather area. It has better balance sheets along with more assurable earnings prospects. A great preponderance of money has rightfully gravitated toward this area.
This phenomenon seems to have been overdone and may go through an adjustment. The core concept is basically strong. It can go too far for periods. It gets exaggerated by the huge amount of money in trend following investment groups that buy the strongest charts.. It is too soon to guess how long an adjustment will take.
The overall backdrop remains filled with nuances. We have a better than expected economy helping earnings as nominal GDP growth is above 5%. The interest rates are in a state of flux because expectations of the Fed cutting rates has diminished. Meanwhile, the long end of rates has a life of its own with trillions dollars of government bonds being sold and sticky inflation.
There are potentially problematic geo political factors. The Middle East set of circumstances could impact inflation. The cold war with China carries some risk to different companies and the Semi conductor industry.
I have yet to figure out the impact of two unpopular presidential candidates..Both have unrealistic platforms.
Next week we get the Q 1 GDP on Thursday. The key report is on Friday, the PCE Inflation numbers.
Consensus Last Month
PCE Headline Prices (mom) Mar 0.3% 0.3%
PCE Headline Prices (yoy) Mar 2.6% 2.5%
PCE Core Prices (mom) Mar 0.3% 0.3%
PCE Core Prices (yoy) Mar 2.7% 2.8%;
The market is extremely oversold and can rally at any point now. It is likely to probe for a bottom over time. Growth has more risk because it is the most heavily owned. A surprise very favorable development could mitigate the depth of a pullback.
Blub, blub
Jerry